Therapy Demographics Calculator
Explore Therapy Usage Patterns
Use this calculator to estimate how demographic factors influence therapy utilization in the United States.
Estimated Therapy Utilization
Select demographic factors to see estimated therapy utilization rates
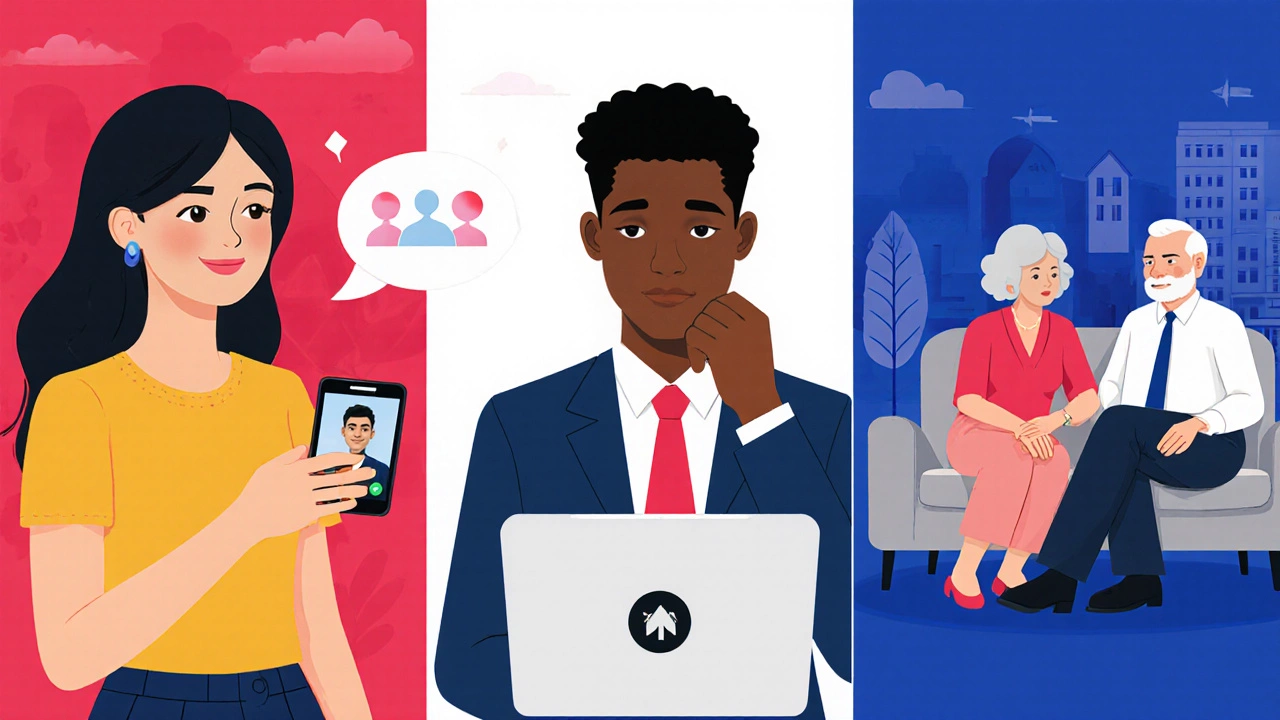
When we talk about therapy as a professional mental health service that helps people manage emotional, psychological, or behavioral challenges, the question “who goes to therapy the most?” comes up instantly.
Key Takeaways
- Women consistently outpace men in therapy visits, but the gap is narrowing among younger adults.
- People aged 18‑34 represent the fastest‑growing segment of therapy users in 2025.
- Higher income and education levels boost likelihood of seeking therapy, yet tele‑health is boosting access for lower‑income groups.
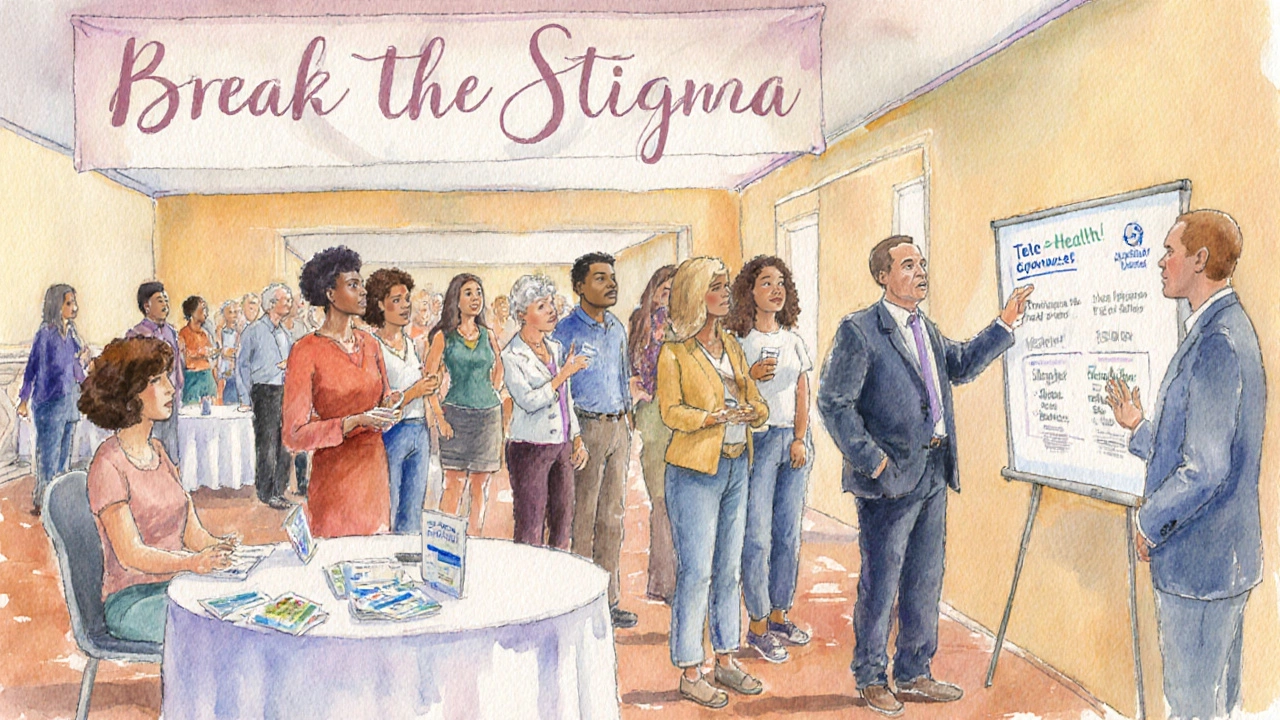
- Stigma remains a major barrier for men, older adults, and certain cultural communities.
- Employers and insurers are now covering virtual counseling, driving a 22% rise in overall therapy utilization since 2022.
What Exactly Is Therapy?
Therapy, also known as counseling or psychotherapy, covers a range of evidence‑based approaches-from cognitive‑behavioral therapy (CBT) to dialectical behavior therapy (DBT). Its core goal is to help individuals identify patterns, develop coping tools, and improve overall mental well‑being. A therapist may be a licensed psychologist, clinical social worker, or a certified counselor.
Who Is Actually Sitting in the Therapist’s Chair?
Data from the World Health Organization, the National Institute of Mental Health (NIMH), and several large tele‑health platforms reveal clear patterns.
Gender Breakdown
Historically, women have been 1.8times more likely to attend therapy than men. In 2025, the gap has narrowed to 1.5times, driven by rising mental‑health awareness campaigns targeting men.
women generally report higher willingness to discuss emotions and seek professional help - a trend reinforced by social‑media movements like #TherapyForAll. Meanwhile, men still face cultural expectations of stoicism that deter them from opening up, though workplace mental‑health programs are making inroads.
Age Groups
Therapy usage spikes in two distinct age brackets:
- 18‑34 years: This cohort accounts for 42% of all therapy sessions in 2025, driven by college‑related stress, early‑career pressures, and the popularity of app‑based counseling.
- 55+ years: Older adults seek therapy mainly for grief, chronic illness coping, and retirement transition, making up 18% of visits.
Adolescents (13‑17) are the third‑largest group, especially for anxiety and bullying issues, but they often access therapy through school counselors or parental referrals.
adolescents frequently present with anxiety, depression, and identity‑related concerns and benefit from short‑term CBT models.
Socio‑Economic and Educational Factors
People with a college degree are 2.3times more likely to have at least one therapy session per year compared to those with a high‑school diploma. Income also plays a part: households earning $75k+ have a 30% higher utilization rate.
However, the rollout of low‑cost tele‑health platforms (e.g., BetterHelp, Talkspace) has increased therapy access among middle‑income and even some low‑income users, adding roughly 5% to the overall market share in 2025.
socioeconomic status influences both ability to afford therapy and awareness of mental‑health resources.
Why Some Groups Seek Therapy More Frequently
Three core drivers explain higher attendance rates:
- Perceived Need: Chronic stress, trauma, or diagnosed disorders (e.g., depression, anxiety) push individuals toward professional help.
- Accessibility: Urban dwellers, college campuses, and workplaces offering on‑site counseling see higher uptake.
- Social Acceptance: Cultures that normalize mental‑health conversations (e.g., many Western societies) encourage people to act on their needs.
depression remains the leading diagnosis prompting therapy, affecting roughly 7% of adults annually in the U.S. anxiety follows closely, influencing 6% of the adult population each year. Both conditions drive the bulk of therapy appointments.
Barriers That Keep Others Away
Even with expanding services, several hurdles deter groups from seeking help:
- Stigma: Deep‑rooted beliefs that therapy signals weakness still affect men, older adults, and many ethnic minorities.
- Cost: Lack of insurance coverage or high copays remain a problem for low‑income families.
- Limited Provider Supply: Rural areas face therapist shortages, leading to long wait times.
- Digital Divide: Older adults may struggle with app‑based platforms.
Recent Trends Shaping Therapy Utilization (2022‑2025)
Several data points illustrate how the landscape is evolving:
| Year | Total Sessions (millions) | Tele‑health % | Women % | Men % |
|---|---|---|---|---|
| 2022 | 78 | 45% | 62% | 38% |
| 2023 | d>8452% | 60% | 40% | |
| 2024 | 91 | 58% | 59% | 41% |
| 2025 | 98 | 62% | 58% | 42% |
The steady rise in tele‑health (now 62% of all sessions) has been a game‑changer, especially for younger adults and those in remote locations.
How to Encourage More People to Seek Therapy
If you’re a manager, educator, or family member looking to break down barriers, try these practical steps:
- Normalize Conversation: Share personal stories or reputable articles about therapy benefits.
- Offer Resources: Provide a list of low‑cost or employer‑covered counseling options.
- Facilitate Access: Arrange on‑site mental‑health days or partner with tele‑health providers.
- Address Stigma Directly: Host workshops that debunk myths, especially targeting men and older adults.
- Monitor Follow‑Up: Encourage repeat visits and check‑ins after the first session.
By tackling stigma and cost together, you’ll see a measurable uptick in therapy attendance across the board.
Quick Reference: Therapy Utilization Cheat Sheet
- Women: 58% of all sessions (2025).
- Men: 42% of all sessions (2025) - still growing.
- 18‑34 age group: 42% of total sessions.
- Tele‑health: 62% of sessions, highest among 18‑34.
- Top diagnoses: Depression (7% prevalence) and Anxiety (6%).
Frequently Asked Questions
Which gender seeks therapy the most?
Women consistently outnumber men in therapy visits. In 2025, women accounted for about 58% of all sessions, while men made up 42%.
What age group uses therapy the most?
Adults aged 18‑34 lead the pack, representing roughly 42% of all therapy appointments in 2025. This surge is linked to college stress, early‑career anxiety, and the popularity of digital counseling platforms.
How has tele‑health changed therapy demographics?
Tele‑health now makes up 62% of all therapy sessions. It has boosted access for younger adults, those in remote areas, and lower‑income groups who previously faced cost or transportation barriers.
Why do men still lag behind in therapy utilization?
Cultural expectations of stoicism, fear of stigma, and fewer targeted outreach programs keep many men from seeking help. Workplace mental‑health initiatives are narrowing the gap, but progress is gradual.
What are the top reasons people seek therapy?
The leading reasons are diagnosed depression (about 7% of adults), anxiety disorders (≈6%), relationship challenges, and work‑related stress. Trauma and grief also rank high, especially among older adults.